This webpage will be regularly updated with the latest results from our ongoing Local Crime Survey. If you have any questions regarding the below results, or would like them in a different format, please contact the Communications Team.
Results from the Local Crime Survey (15 November 2022 – 15 August 2023)
The local crime survey launched on 15th November 2022 with 5,457 responses submitted by the end of December 2022 and a total of 8,797 submissions by 15th August 2023.
Over 7,400 respondents provided a postcode. 2,910 of these responded for Berkshire (6 local areas), 2,066 for Oxfordshire (4 local areas), and 1,610 for Buckinghamshire along with an additional 877 for Milton Keynes.
The survey responses suggest that:
- Most felt safe in their local areas
- People agree that all crime should be reported to the police
- 64% of victims who responded actually reported crime to the police
- Most people trust Thames Valley Police
- People receive positive engagement with the police in the early stages of reporting, but would like more engagement in the subsequent stages of investigation and victim support
Perceptions of safety
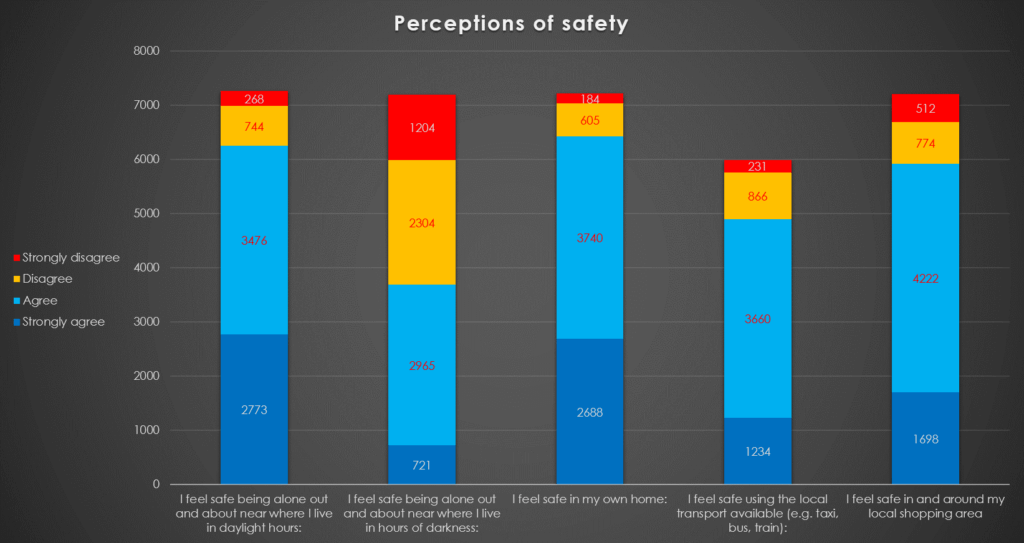
The above bar chart illustrates responses to a series of questions around perceptions of safety for residents of Thames Valley:
- Bar 1 illustrates responses to the question ‘I feel safe being alone out and about near where I live in daylight hours’. A total of 38% strongly agreed with this statement, 48% agreed, 10% disagreed and 4% strongly disagreed.
- Bar 2 illustrates responses to the question ‘I feel safe being alone out and about near where I live in hours of darkness’. A total of 10% strongly agreed with this statement, 41% agreed, 32% disagreed and 17% strongly disagreed.
- Bar 3 illustrates responses to the question ‘I feel safe in my own home’. A total of 37% strongly agreed with this statement, 52% agreed, 8% disagreed and 3% strongly disagreed.
- Bar 4 illustrates responses to the question ‘I feel safe using the local transport available (e.g. taxi, bus, train)’. A total of 21% strongly agreed with this statement, 61% agreed, 14% disagreed and 4% strongly disagreed.
- Bar 5 illustrates responses to the question ‘I feel safe in and around my local shopping area’. A total of 23% strongly agreed with this statement, 58% agreed, 12% disagreed and 7% strongly disagreed.
Victims of crime – last 12 months
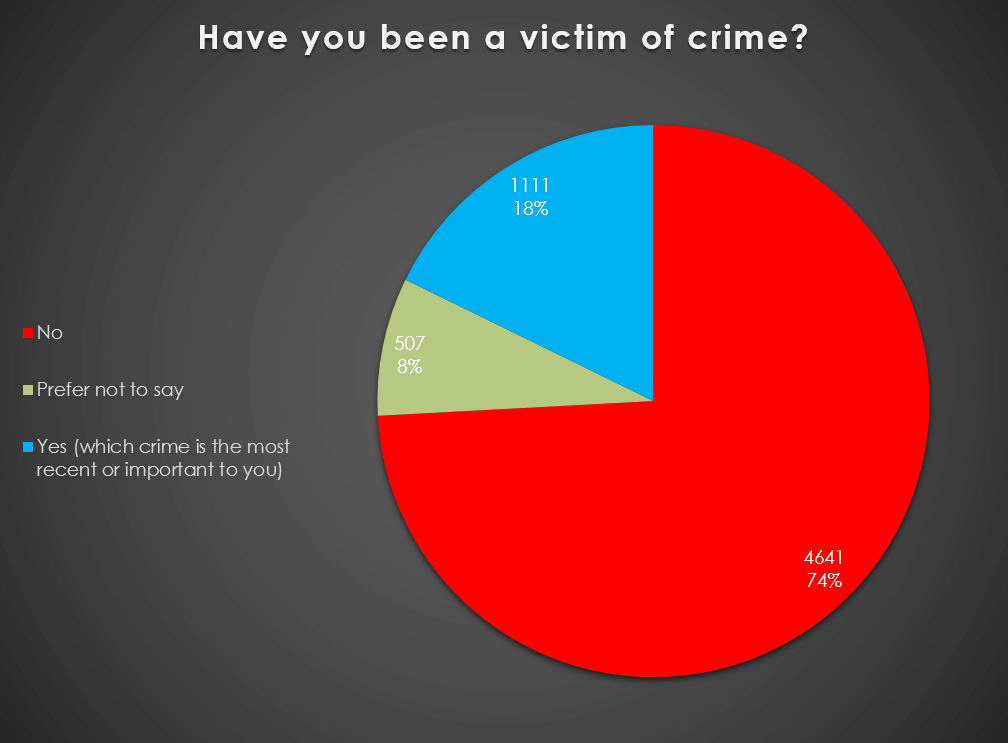
The above pie charts illustrate responses to the following questions regarding whether respondents were a victim of crime in the last 12 months:
- Pie chart 1 (left) illustrates responses to the question ‘Have you been a victim of crime’. A total of 74% stated ‘No’, 18% stated ‘Yes’ and 8% stated ‘Prefer not to say.
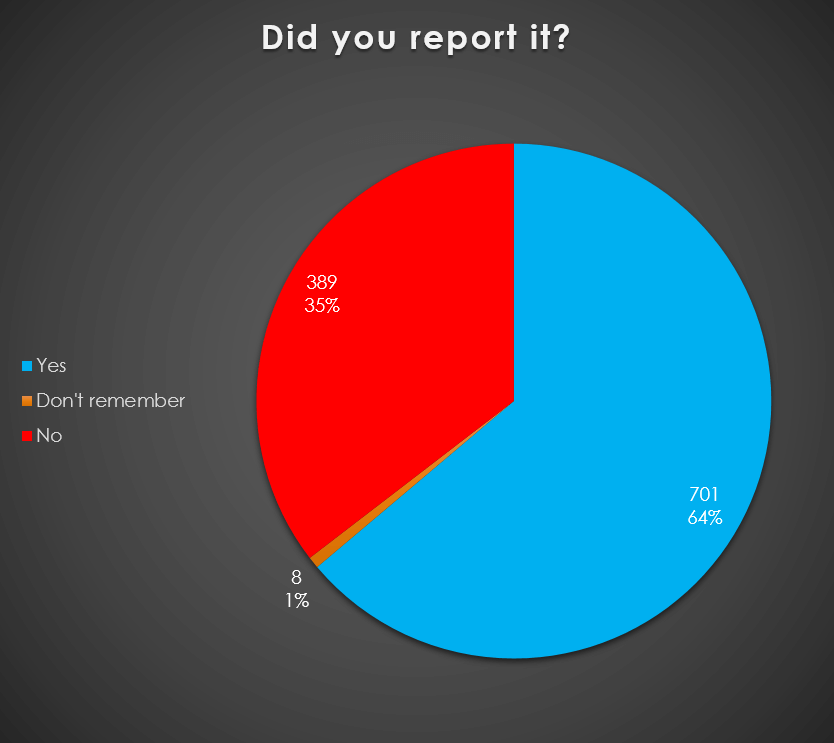
- Pie chart 2 (right) illustrates responses to a follow up question (to those who answered ‘Yes’ above) ‘Did you report it’. A total of 64% stated ‘Yes’, 35% stated ‘No’ and 1% stated ‘Don’t remember.
Experiences and perceptions of crime
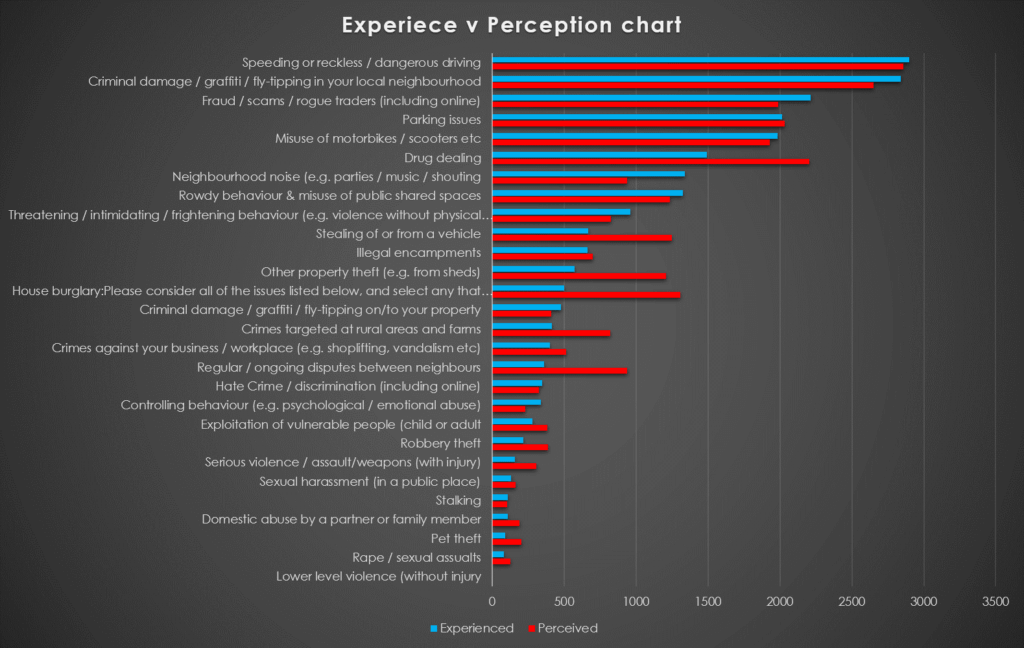
The above bar chart shows which crimes respondents had directly experienced and which they perceived to be an issue locally.
The three crimes that people said they directly experienced most often in the last 12 months were as follows:
- 1) Speeding or reckless / dangerous driving
- 2) Criminal damage / graffiti / fly-tipping
- 3) Fraud / scams / rogue traders (including online)
The three crimes people said they felt were an issue locally by respondents were as follows:
- 1) Speeding or reckless / dangerous driving
- 2) Criminal damage / graffiti / fly-tipping
- 3) Drug dealing
Police perceptions
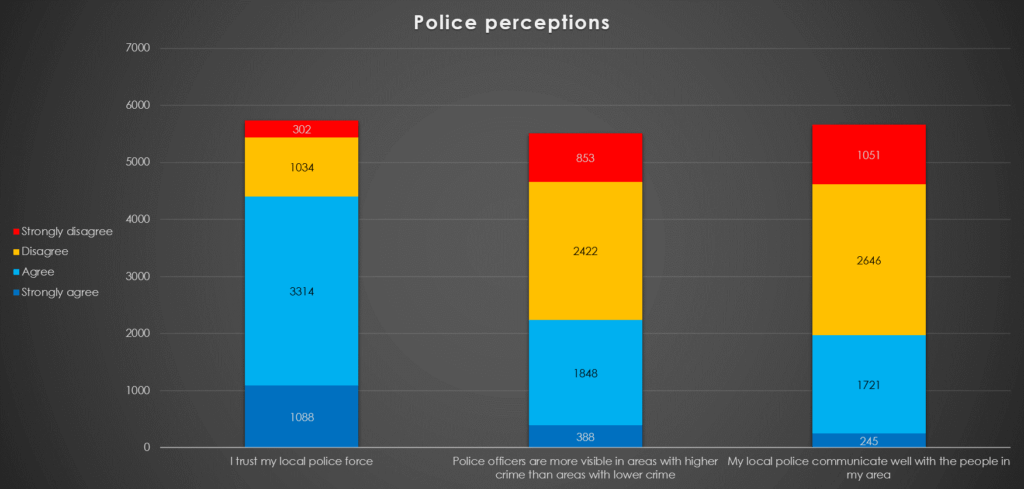
The above bar chart shows how people responded to three questions specifically about Thames Valley Police:
- Bar 1 illustrates responses to the question ‘I trust my local police’. A total of 19% strongly agreed with this statement, 58% agreed, 18% disagreed and 5% strongly disagreed.
- Bar 2 illustrates responses to the question ‘Police officers are more visible in areas with higher crime than areas with lower crime’. A total of 7% strongly agreed with this statement, 33% agreed, 44% disagreed and 16% strongly disagreed.
- Bar 3 illustrates responses to the question ‘My local police communicate well with the people in my area’. A total of 4% strongly agreed with this statement, 30% agreed, 47% disagreed and 19% strongly disagreed.
Communicating with police
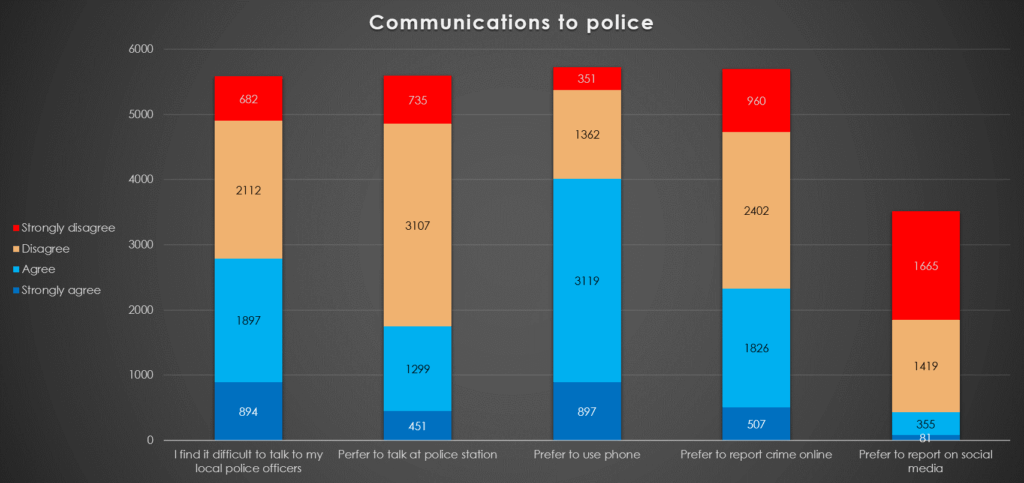
The above bar chart shows how people responded to questions about communication with Thames Valley Police:
- Bar 1 illustrates responses to the question ‘I find it difficult to talk to my local police officers’. A total of 16% strongly agreed with this statement, 34% agreed, 38% disagreed and 12% strongly disagreed.
- Bar 2 illustrates responses to the question ‘I would prefer to go to the police station to talk to the police’. A total of 8% strongly agreed with this statement, 23% agreed, 56% disagreed and 13% strongly disagreed.
- Bar 3 illustrates responses to the question ‘Prefer to use the phone’. A total of 16% strongly agreed with this statement, 54% agreed, 24% disagreed and 6% strongly disagreed.
- Bar 4 illustrates responses to the question ‘I would prefer to report crime online’. A total of 9% strongly agreed with this statement, 32% agreed, 42% disagreed and 17% strongly disagreed.
- Bar 5 illustrates responses to the question ‘I would prefer to report crime on social media’. A total of 2% strongly agreed with this statement, 11% agreed, 40% disagreed and 47% strongly disagreed.
Reporting crime
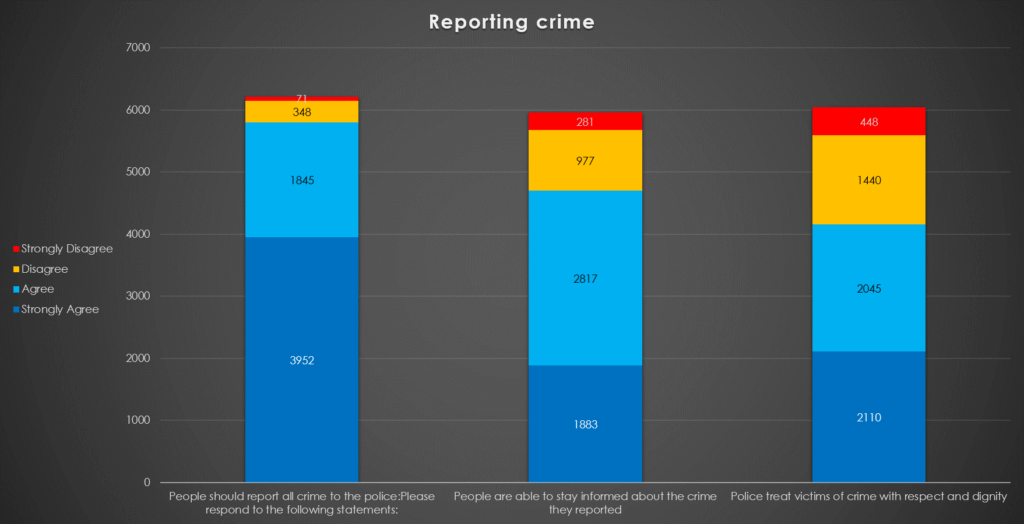
The above bar chart shows how people responded to questions about reporting crime:
- Bar 1 illustrates responses to the question ‘People should report all crime to the police’. A total of 64% strongly agreed with this statement, 30% agreed, 5% disagreed and 1% strongly disagreed.
- Bar 2 illustrates responses to the question ‘People are able to stay informed about the crime they reported’. A total of 32% strongly agreed with this statement, 47% agreed, 16% disagreed and 5% strongly disagreed.
- Bar 3 illustrates responses to the question ‘Police treat victims of crime with respect and dignity’. A total of 35% strongly agreed with this statement, 34% agreed, 24% disagreed and 7% strongly disagreed.
Support for victims
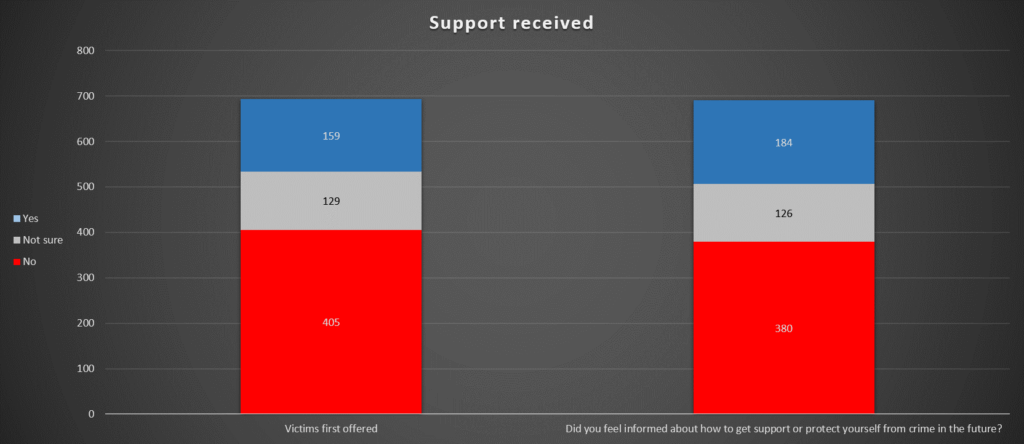
The above bar chart shows how people responded to two questions about support for victims: (Note: only those who responded that they had been a victim of crime were able to respond to these questions)
- Bar 1 illustrates responses to the question ‘Did the police mention or offer you further support from a service called Victims First service?’ A total of 58% stated ‘No’ for this question, 19% stated ‘Not sure’ and 23% stated ‘Yes’.
- Bar 2 illustrates responses to the question ‘Did you feel informed about how to get support or protect yourself from crime in the future?’ A total of 55% stated ‘No’ for this question, 18% stated ‘Not sure’ and 27% stated ‘Yes’.
Views on consequences
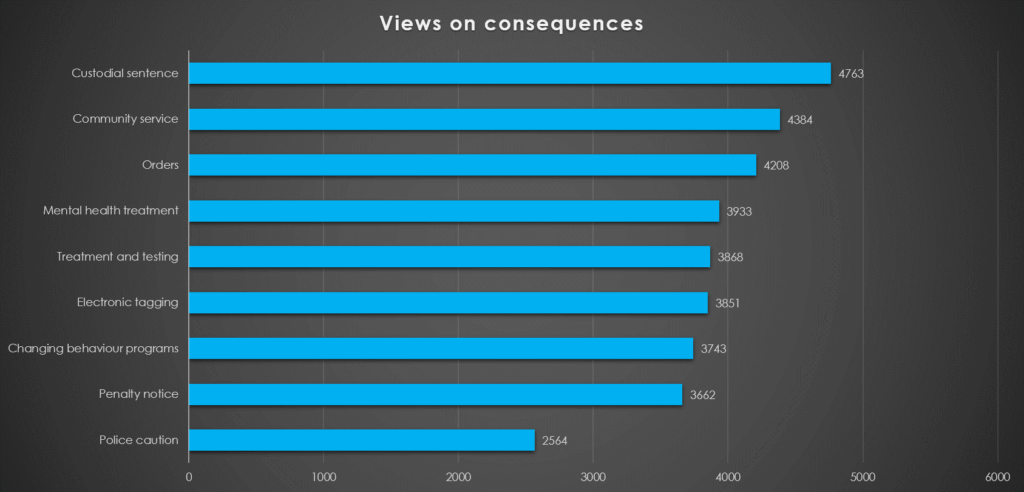
The above bar chart shows how supportive respondents are of various consequences for committing crime and disorder:
- 1) 4,763 respondents supported use of a Custodial sentence (prison)
- 2) 4,384 respondents supported use of Community Service/Unpaid Work
- 3) 4,208 respondents supported use of Orders (e.g. curfew or exclusion from locations / people)
- 4) 3,933 respondents supported use of Mental health treatment
- 5) 3,868 respondents support use of Treatment & testing (e.g. for addictions)
Use of Council Tax funding
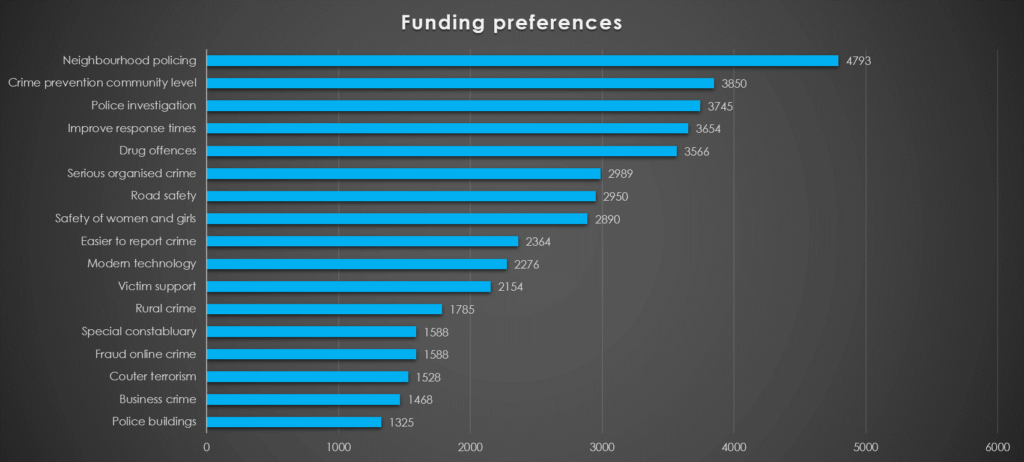
The above bar chart shows the areas that respondents believe the Police & Crime Commissioner should invest Council Tax funding:
The five areas selected most often were as follows:
- 1) Increased Neighbourhood policing (4,793 respondents)
- 2) Increased Crime prevention – (3,850 respondents)
- 3) Increased Police investigation – (3,745 respondents)
- 4) Improving Response times – (3,654 respondents)
- 5) Tackling Drug offences – (3,566 respondents)
Additional resources
Find out how you can contact the PCC

Stay up to date with the work of the PCC